


Google Analytics is a web analytics service that provides statistics and analytical tools about your website. Google Analytics allows users to track up to 200 different metrics to measure their website performance.
While certain metrics may be more valuable to some businesses than others, some metrics are less relevant. Therefore, we have prepared a glossary of relevant terms for Google Analytics; here are some of the most popular metrics:
Google Analytics Glossary - 2023 Edition
Account
Your account is where everything happens in Google Analytics. You will have access to a single account that stores data for your site, but if you manage multiple sites that are not directly related to each other, they can be stored in separate accounts. For example, if you manage your company site and your personal blog at the same time, accounts (and their properties) can be shared with multiple users.
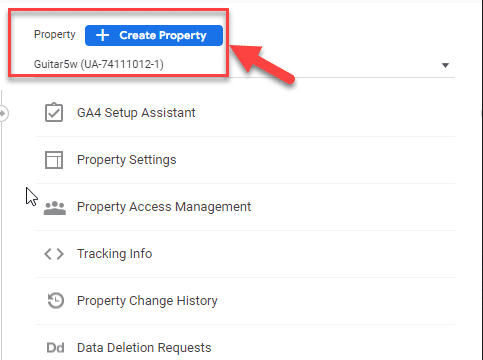
Property
Properties are created within a Google Analytics account. Each property represents an instance of the tracking ID used to collect data from a website, group of websites, mobile app, and more. Each property will include data sent to the associated tracking ID. Once data is collected, it is processed in the reporting view (or views) created under the property.
New User
People who visited your site for the first time within the selected date range. Since users are based on the Google Analytics tracking code and browser cookies, it is important to emphasize that people who cleared their cookies or accessed your site using a different device will be reported as a new user.

Session
A single visit to the site, consisting of one or more page views, along with events, ecommerce transactions, and other interactions. The default session timeout is 30 minutes, which means that if someone is inactive on your site for more than 30 minutes, a new session will be reported if they make another interaction, for example, viewing another page.

Page per Session
A user engagement metric showing the average number of page views per visit.

Page View
A pageview is reported when a page is viewed by a user on the website. In the Google Analytics Pages report, by default, your pages are sorted by popularity based on pageviews. This allows you to see which content is viewed most frequently.

Active Users
Active users are the number of engaged users on your site. To be considered active (or engaged), a user needs to have the web page in focus for at least one second.

Attribution
Attribution allows you to control how credit for a conversion is assigned to the marketing channels that led to the action. Google Analytics provides a variety of attribution models in ‘Advertising’ reports, and you can configure default attribution reports using ‘Attribution Settings’ by navigating to ‘Admin’. Attribution considers the channels (and traffic sources) used across multiple sessions for a user. You can configure the amount of historical data included in reports using the lookback window. Learn more about attribution in Google Analytics.

Cookie
A cookie is a piece of information stored in a website browser. Google Analytics uses cookies to identify users. If someone does not have an existing cookie, a new cookie will be created and they will appear as a new user in your reports. If someone has an existing cookie, they will be reported as a returning user and the cookie expiration will be updated.
Acquisition
You can understand how people find your site using the Acquisition reports. The reports display data based on the source and medium of your visitors, along with additional acquisition dimensions. There are dedicated reports for your paid traffic via Google Ads, organic traffic from Google (SEO), social networks, and more.

Average Session Duration
Provides a top-level view of the amount of time users spend on your site. For example, if there were two users, one who spent three minutes on your site and another who spent one minute, you would have an average session duration of two minutes. Google Analytics does not count time for the last page viewed during a session. This means that average session duration tends to be lower than the actual amount of time people spend on your site.

Bounce
A bounce is reported when a user’s session contains only a single page view. The idea is that someone arrives at your site, ‘bounces’, and leaves after viewing only a single page, without performing any action.
Bounce Rate – This is the percentage of sessions that ended on the entrance page without any action, out of all sessions on the site.

Conversion
A conversion is reported every time a user completes a goal or makes a purchase during a session. Each goal will report one conversion per visit, while every transaction is reported.

Cross Device
Cross-device reporting in Analytics takes into account people who visited your site multiple times from different devices. Instead of seeing metrics in Analytics that show two separate visits (e.g., one on desktop and the other on mobile), you will be able to see when users visited your site from two different devices. By understanding these device interactions as part of a broader customer experience, you can make more informed decisions about products and marketing.

Demographics
Google Analytics can be configured to include user demographic data, such as age and gender. To collect demographic data in your reports, you must enable ‘Advertising Features’ by navigating to ‘Admin’, then ‘Tracking Info’, and selecting ‘Data Collection’.

Device Category
Device Category allows you to view performance based on the different devices people use to experience your site. You can see sessions occurring on Desktop (which also includes laptop devices), Tablet, and Mobile.

Dimension
A dimension in Google Analytics is an attribute of data. If you take the time to look at your dimensions in more detail, you can learn a lot about your users, including where in the world they are based, the language they speak, the device they use to access your site, and much more.

Ecommerce Conversion
An ecommerce conversion occurs when someone successfully makes a purchase during a session. Google Analytics has a variety of ecommerce dimensions and metrics to report on your site’s ecommerce activity.

Event
A custom interaction (or feature) tracked from your site into Google Analytics, for example, tracking embedded video plays. Each event can include up to three dimensions (the event ‘Category’, ‘Action’, and an optional ‘Label’) and a metric (the optional event ‘Value’). Events require custom tracking implementation and are then reported within the standard ‘Behavior’ reports. Events can also be used to set up event-based goals.

Goal
Goals are used to track desired actions on your site. For example, signing up for your email newsletter, submitting an inquiry, or registering as a member. Goals can be configured within Google Analytics and can be based on people navigating to a specific page (or pages), triggering an event, sessions of a certain duration, or viewing a specific number of pages.

Hit
A hit is the way data is sent to Google Analytics before it is processed in your reports. The most common type of hit occurs when a page is viewed on your site. Hits are also sent to Google Analytics for other types of interactions, including events.
Lifetime Value (LTV)
Lifetime Value metrics, including Lifetime Revenue Per User and Lifetime Revenue, show you the total value based on users, rather than site sessions.

Source
Source is one of the four main dimensions (along with Medium, Campaign, and Channel) for reporting and analyzing how people found your website. The source tells you where the message was seen. For example, a source of ‘google’ indicates that someone found your website after performing a Google search. Source can be used in combination with Medium for more detailed insights, for example, a source of ‘google’ and a medium of ‘cpc’ will report for paid clicks from your Google Ads campaigns.

Medium
Medium is one of the four main dimensions (along with Source, Campaign, and Channel) for reporting and analyzing how people found your site. Medium tells you how the message was delivered. For example, ‘organic’ for free search traffic, ‘cpc’ for cost-per-click, and ‘referral’ for inbound links from other websites.

Referral
A referral is reported when a user clicks through to your site from another third-party site. The Referral report allows you to see all the websites (by domain) sending you traffic. You can also drill down into the referral report to see the ‘Referral Path’, which allows you to view the individual pages linking to your site.

Summary
Google Analytics is the leading tool for monitoring and analyzing traffic to your site. It provides a massive amount of information about who visits the site, what they are looking for, and how they reach your site, making it undoubtedly a tool that every business owner/marketer/website owner must know and understand at least at a basic level. Therefore, you must master its terms to understand the data within it.
About the Author
Ben Kanaani, Campaign Manager at Fialkov Digital. 26 years old, #1 optimizer and a campaign manager at heart. Loves sports and mom’s food
