


Google Analytics is one of the primary systems used by websites and online stores today. It provides insights packed with rich analytics regarding website traffic and visitors, as well as analytics related to eCommerce. All the data it provides can be used by you, eCommerce store owners, to reach new customers and increase conversions. If you are a new online store owner encountering Google Analytics for the first time, the tool might be overwhelming due to the data overload and technical reports that are hard to understand at first. In this guide, you will learn how to set up Google Analytics for an eCommerce store and get to know the relevant reports in Analytics Enhanced Ecommerce.
To deeply understand Google Analytics and the options available in this system, I recommend reading the Google Analytics Beginner’s Guide and the Google Analytics Reports Guide.
Why use Google Analytics for eCommerce?
If you have ever logged into Google Analytics in the past, you have likely seen hundreds of graphs and reports explaining in detail what happens on your site – how many people visited, where they came from, what device they used while browsing, and more. If you enter without understanding what information you are looking for, you won’t get much value or benefit from it. Using Google Analytics is relevant depending on the current stage of your store. If you have one sale a month, you won’t be able to derive meaningful eCommerce store insights or customer lifetime value metrics. However, as your business expands and the volume of sales increases, you need to dive deeper into Analytics Enhanced Ecommerce data to optimize and refine marketing channels and increase store conversions.
How to implement Analytics eCommerce on a WordPress site?
To implement eCommerce analytics on your website, you will first need to install Google Analytics on your site and then enable the Analytics Enhanced Ecommerce settings. To install Google Analytics, you will need a Google account. If you already have a Gmail account, you can use it. If not, create a new Google account.

- Go to Google Analytics and click on Create an account
- Once you are logged into Google Analytics, click on Create New Account. This will create a new Analytics account for you to track your website analytics.
- On the next screen, enter your website URL and fill in the required details.
- Click on Get Tracking ID at the bottom of the page to receive your tracking code.

- On the next page, you will need to copy your tracking code and embed it on the site. The tracking code will look like this:
					<!-- Global site tag (gtag.js) - Google Analytics -->
<script async src="https://www.googletagmanager.com/gtag/js?id=G-#########"></script>
<script>
  window.dataLayer = window.dataLayer || [];
  function gtag(){dataLayer.push(arguments);}
  gtag('js', new Date());

  gtag('config', 'G-#########');
</script>console.log( 'Code is Poetry' );
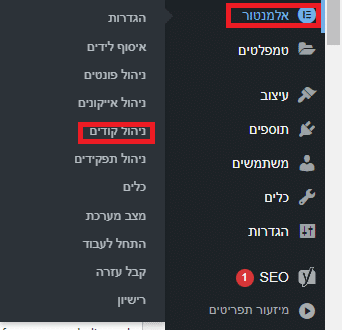
- To install your tracking code on a WordPress site, you can do so by directly editing the theme or by embedding it via the popular page builder – Elementor (using Elementor is recommended as it embeds the code safely without requiring you to edit the theme code yourself). Click on Elementor and then on Custom Code.
- At the top of the page, click on Add New, give a title to the new code you are embedding on the site (it is recommended to name the code source “Analytics”, so that if multiple codes are installed on your site you can distinguish between them), paste the code, click on Publish, and under the Include tab, choose to embed the code across the entire site.
- Finally, click on Save & Close
- After adding the code to your site, the final step you will need to perform is enabling the tracking features for eCommerce sites:
- Click on Admin at the bottom of the Google Analytics screen
- Select your account
- Under the View Settings tab, click on the Ecommerce Settings option
- Toggle the option to On and click on Save.

- After you click to enable eCommerce, an additional option will become available—Enable Enhanced Ecommerce Reporting. By enabling this second option, you can get dynamic eCommerce reports. These reports can be generated by implementing enhanced ecommerce tracking codes. The implementation codes can be found here. We recommend a more convenient installation using the PixelYourSite plugin – follow our guide PixelYourSite Settings for Online Stores.
Note: It may take up to 24 hours for Google Analytics to start collecting data and information from your website.
Relevant Analytics reports for eCommerce sites that you can generate
Google Analytics offers a vast array of reports that can be created and generated. Alongside the basic overview reports that contain a wealth of information and great insights for beginners, eCommerce stores have dedicated reports that help you understand visitor behavior in your store. Using the insights gathered from these reports, you can improve the conversion rate and increase the total number of conversions in your store.
Acquisition Reports

Acquisition reports provide information about how visitors to your store found you and how they arrived at the store. With these reports, you can understand what works and what doesn’t work for you in attracting more visitors to the store. The Acquisition Overview report helps you understand:
- Which channels drive the most visitors
- Which channels drive the most visitors who interact with the site
- Which channels drive the most visitors who generate sales
What can you do with this data?
Acquisition reports can provide several key insights into how people find your site and from which traffic sources you manage to convert visitors. This way, beyond reaching more people, you will be able to reach more people relevant for conversions.
Behavior Reports

The Behavior Reports option contains reports designed to help you improve the content on your site and how visitors interact with it. This includes information about page load time and site browsing speed, which greatly impact SEO as well. Behavior reports also help you identify the Bounce Rate, which represents the percentage of people who leave your site after viewing only a single page (a red flag on eCommerce sites). If you can identify which pages have the highest drop-off rate, you can focus on improving the browsing experience on those pages.
What can you do with this data?
Visitor behavior reports can help you better understand areas of your website that need immediate improvement. Once you draw conclusions and optimize high-bounce pages, you will be able to create a better browsing experience for the customer, improving their shopping experience on the site and boosting the conversion rate.
Conversion/Ecommerce Analytics Reports

Ecommerce reports under the Conversions menu are essentially the reason you enabled eCommerce settings in Google Analytics. Connecting to your store website and using enhanced ecommerce settings will send information about your products, sales, and conversions directly into Google Analytics reports. Using ecommerce reports helps you extract the following information:
- Products – Which products your website visitors purchase, in what quantity, and the revenue generated by purchasing those products.
- Transactions – Revenue details, tax, shipping costs, and quantity for each transaction.
- Time to Purchase – The number of days and the number of sessions on the site it takes until a purchase is completed.
What can you do with this data?
As you begin generating more sales, understanding these sales through Google Analytics eCommerce tracking will become more essential for you and will help you increase the volume of conversions and the conversion rate.
- By understanding which products sell better, you will be able to understand which products are suitable for your customer base and which products sell via the campaigns and marketing funnels you built for them.
- Your profit per transaction and the average number of items per transaction can help you better understand whether you can offer discounts to new visitors or repeat customers and still profit from the transaction, or alternatively waive shipping costs and absorb them into the total product price.
Advanced Reports in Analytics Ecommerce
Ecommerce reports in Google Analytics can seem like a massive amount of data that might be overwhelming at first glance. To help you make sense of these reports’ final output, we have divided the reports into relevant questions that every online store owner asks themselves throughout their work.
At what stage in the purchase process do visitors leave?
Enhanced Ecommerce is an additional feature in Google Analytics that can tell you exactly at which stage of your purchase funnel a website visitor drops off. Advanced Ecommerce reports for the checkout process display the different stages a visitor goes through before making a purchase. This includes:
- All sessions
- Sessions with product views
- Sessions with add-to-cart actions
- Sessions that reached checkout
- Sessions that ended in a transaction
If your store has a good flow to product pages, you can track the number of add-to-cart actions, and subsequently checkouts and purchases. All of this is aimed at understanding at which stage on your site visitors get stuck and what you can do to help your website visitors complete the purchase. To access the report, click on Conversions, then Ecommerce, and finally on Shopping Behavior.

Which marketing channels bring the best customers?
If you are running campaigns across several different advertising platforms (Google Ads, Facebook Business Manager, etc.), with the help of this report you will be able to focus on the marketing channels that delivered the best performance. The best performance is measured by conversion rate, number of sales, and order value. Through advanced ecommerce tracking, Google Analytics can provide you with an up-to-date report on your profitable marketing channels, but beforehand, you will need to link your advertising accounts to the platform. To access the full report, click on Acquisition, then on All Traffic, and finally on Source/Medium.

Which products generate the most revenue?
Knowing which products generate the highest revenue for you can give you great ideas for increasing sales. The Quantity column will show you how many units are sold. And the Unique Purchases column will show you how many customers purchased. If you see multiple customers buying multiple units of the same product, that is something worth pausing to investigate—can you increase the average order value by offering a bulk discount? Overall, Product Revenue will tell you how much revenue each specific product generated, giving you direction on adding or removing products from the store. To reach the full report, click on Conversions, then on E-commerce, and finally on Product Performance.

What can be done to sell more?
What to do to sell more is a very general question, and it is divided into 3 answers, each addressing a different topic:
- Get more visitors – improve marketing
- Get more sales from visiting users – improve the website
- Achieve higher conversion value on purchases – increase average order value
Analyzing and comparing orders on your site allows you to understand exactly what actions you need to take to increase each of the factors driving sales growth. If your site does not generate enough traffic, refine your campaigns and perhaps consider using additional advertising platforms. If there is enough traffic but not enough sales, improve the on-site user experience, and if there is plenty of traffic and plenty of sales but revenue is still low, focus on increasing the average order value.der value. low, encourage customers to increase their shopping cart size through promotions and popups. To reach the report, click on Conversions, then on E-commerce, and finally on Sales Performance.

Using Campaign URL Builder to Track Campaigns in Google Analytics
One of the most important things to track in Google Analytics is your campaigns that generate traffic to the site. Google Analytics allows you to easily track campaigns using a dedicated URL. All you need to do to track campaigns automatically is to use Google’s Campaign URL Builder tool to generate a trackable URL:

To use this tool, you need to enter the link you want to track and some information to describe the specific campaign you chose to track. After filling in this information (you don’t have to fill in all fields), Google will provide you with a link that can be used for tracking. To view all the performance data for your campaigns, click on Acquisition in Google Analytics and then on Campaigns.
Summary
Reports in Google Analytics can be intimidating at first glance. Just logging in for the first time and seeing a collection of charts and data without understanding what information you need can be hard to digest. To help you understand Google Analytics eCommerce data, it is important to familiarize yourself with the key terms in Google Analytics, and even more important to understand the purpose of your visit and which reports you want to view. Using Analytics Enhanced Ecommerce helps store owners understand visitor traffic in the store and maximize it.
About the Author
Dvir Naaman, 26 years old, an entrepreneur at heart, passionate about eCommerce sites, and specializing in SEO.
