


Facebook’s reporting system for advertisers is no longer new, at least not in Facebook terms. Still, many advertisers miss the tremendous potential that exists in this system. The structure of the system allows for more accurate reporting and focus on real goals (conversions) and not just clicks. One of the prominent advantages of the system is the very user-friendly design. Advertisers at all levels can easily navigate between the various reporting options and customize the data according to their goals.
In the article before you, I will review 5 advantages that make Facebook’s reporting system for advertisers an indispensable tool on the left in the Ads Manager system
Customized Reports
Gone are the days of generating reports and then deleting 10 columns in Excel to present the data you need. In the reporting system, you can choose exactly the metrics you want to see, including conversions within Facebook and on your website. Facebook has actually consolidated all old report types into one structure that is easy to follow and customize according to your goals. Want to see how many conversions a specific ad generates and what the cost per conversion is for men versus women? You can get all this data in one simple report.
The report generation process:
Go to the Ads Manager and at the top right part we can see the metrics

Now we will briefly review some of the amazing capabilities this system has to offer.
We can choose which metric to use:
BreakDown – segmentation by day, hour, platform, age, country, device, and many other options
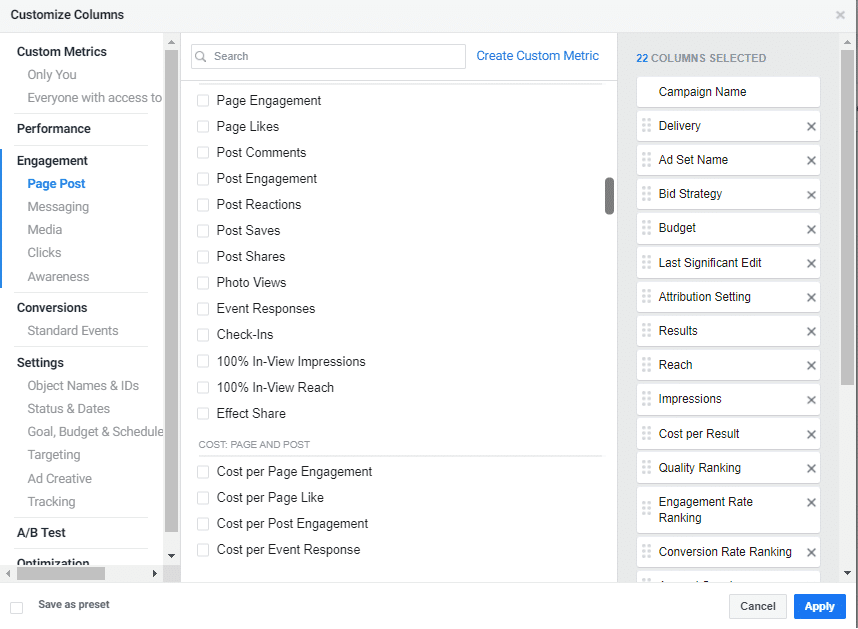
Columns – We can arrange the metrics according to our campaign goal, and this way all the data will be right before our eyes in a very organized manner (number of clicks, impressions, conversions, cost per conversion, engagement, and more)
Now we will present important metrics that will help you manage your campaigns more effectively
Engagement
Engagement – here we can select all the information we want to track: likes, shares, cost per page like, and more. If one of your campaign goals is to generate post engagement, this breakdown will definitely be useful for you. You can break down by number of shares, how many times your post was saved, how many times the photo was viewed, what the cost was, and more. Don’t forget the Breakdown metric through which you can see activity by days and hours, and thus know if the price increased in a certain period, and analyze performance more effectively (whether it declined or improved)
* Golden Tip – You can compare performance of a current time period to another time period (for example, this month Sep vs. Aug)
And this way you can measure performance and understand if there was a decrease or increase in campaign data

Conversion Value and Cost per Conversion
One of the things that interests us most as Facebook marketers is conversions, and mostly those that occur on our website. To do this, we will place pixels on our website (here is a guide to measuring conversions using Facebook pixels), and add the information that interests us to the report: website conversions (according to the types of pixels we selected), conversion value, and cost per conversion.
Our options here are endless, and we can see a metric for almost any data point we care about
E-commerce websites – we can see metrics such as add-to-cart count, cart value, how many people initiated checkout, purchases, return on ad spend, and many other interesting and important metrics
Brand websites and landing pages – we can measure how many leads came in, how many registrations, how many website searches, how many people clicked on the phone number on the site, and many other diverse options

An example of report analysis: We have 3 active audiences in the current campaign, each having the same creative but a different segmentation. In each, we can see how much money we spent, how many clicks went to the landing page (in the first audience, 44% of the clicks come through it compared to the second and third audiences), we can see how much revenue we had from each campaign, and how much each conversion cost us. This information is very essential for us when we want to optimize the advertising campaign
*Please note that the Breakdown segmentation is no longer available for the conversions metric due to iOS 14 attribution.

While the first two ads had a positive ROI according to the goals I set for myself, the third ad received more expensive clicks. In this way, we can decide which ads to keep and which ads to pause.

You can see the improvement in the campaign day by day, the cost per lead decreases day by day and the number of clicks increases.
Age and Gender
Ads can be checked by age and gender – using the BreakDown metric, Facebook’s reporting structure allows us to see this data clearly. You can see exactly which ads achieve the best performance across different age or gender groups, and which demographics provide the lowest cost per conversion.
1. We can break down the ad campaign by age, gender, country, and placement:

2. We will select segmentation by age and gender, and we can see interesting results such as which ages are worth advertising to in order to get cheap clicks:

You can see that we got cheaper clicks among men than among women, mainly in the 25-44 age range. In this case, it is better to advertise only to men and only to younger age groups.
Suppose we use two different ads in an advertising campaign. In the reports, we can see how different age and gender groups respond to both images, so that we can optimize the creative accordingly (hint: this can save you a lot of time and money). You will also get a good indication of whether the ads are attracting the right audience. In addition – do not forget to pay attention to age or gender groups that have a negative impact on your campaign. Perhaps among women aged 25-34 the results are less effective than men, so we might consider excluding them from the campaign.
Placements
We have options to control ad placement, and it is important to know which placement gives you the best performance so you do not waste money on ineffective placements:

We usually assume that the best performance will be in the News Feed, but the News Feed is divided between desktop and mobile. We want to know which specific placement gives us a better conversion rate. This can be easily answered by segmenting per ad in a single report according to the Device Platform metric

This report shows that the cheapest ads are in the Desktop News Feed, and the most expensive ads in terms of cost per click come from Android tablet devices
After arranging and preparing all the metrics according to our campaign goals, we can analyze the campaigns more broadly, understand where the campaign underperformed, draw conclusions, and perform optimization efficiently. What is most effective about this report is that it can be saved and worked with using our metrics on a regular basis!
When we have arranged the columns as we wanted, click on the Save button and name our column view
Now, by default, every time we enter the account, the columns will be arranged in the order we defined

Summary
I recommend that every marketer engaged in sponsored advertising on Facebook take a closer look at Facebook’s reporting system and look for ways to extract more value from it for campaigns. Through managing your Facebook page, use customized reports to get the exact data you need, add conversion tracking to reports, analyze age/gender metrics to refine optimization for goals, and examine different placement options to ensure that the audience sees and responds to your ads in the right placement at the lowest cost. In addition, pay attention to the impact of Facebook ads on conversions from elsewhere. Facebook’s reporting system makes your work easier and improves your ability to prove return on investment (ROI).
Or Fialkov is the CEO and owner of Fialkov Digital, a digital marketing and advertising agency. He runs paid campaigns on Google, Facebook, Instagram, YouTube, LinkedIn, and TikTok, and builds websites and landing pages. He also implements AI in businesses, including AI agents, agentic marketing automation, AI reporting systems, GEO (Generative Engine Optimization), and AI video for campaigns.
